
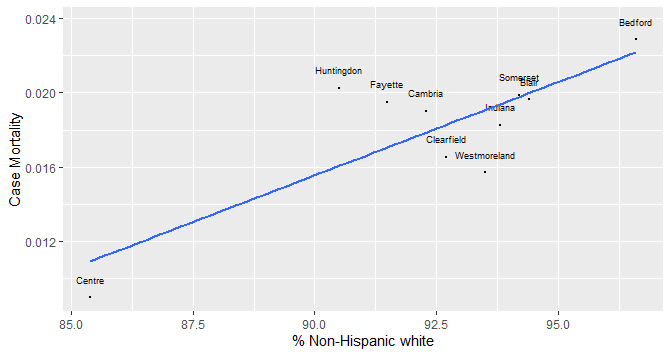

Last week, I looked at the % of the county population that is non-Hispanic White predicting county case mortality and vaccination rates. There was a positive correlation between this percentage and case mortality and a nearly equal negative correlation between this percentage and vaccination rates in these counties. This week I’ll take a look at ethnicity predicts case mortality and rural population predict vaccination rates. The demographic variables are from county health rankings.

The % of the county population that is of Asian descent has a high negative correlation with case mortality accounting for 77.5% of the variability. For every 1% increase in the Asian population, there is a predicted 0.002 decrease in case mortality. There was no significant correlation between % Asian and vaccination rates.
Centre County is a highly influential county in this relationship with an Asian population six times higher than any other county. This is the county where Penn State is located. If this county is excluded, the relationship is still negative but weaker accounting for 30.7% of the variability.

The other demographic variable associated with case mortality is the % of the county population that is of Hispanic origin. This relationship was significant accounting for 44.8% of the variability in case mortality. For every 1% increase in the Hispanic population, there is a predicted 0.004 decrease in the case mortality. Like % Asians, there was no significant correlation between % Hispanic and vaccination rates.
As we can see in the above graph, there is more variability in the size of the Hispanic populations than for Asian populations. The percentage of African Americans in the county was not significantly associated with case mortality or vaccination rates. As % Asian and Hispanic increases, case mortality and the % of non-Hispanic white decreases.
% Rural

The percentage of Asian and Hispanic populations in the ten counties explain correlations with case mortality but not vaccination rates. The % of the county population that is rural was significantly associated with vaccination rates but not case mortality. This relationship accounts for 65.4% of the county population. For every 1% increase in the rural population, there is a predicted 0.003 decrease in the vaccination rate. This is how ethnicity predicts case mortality and rural population predicts vaccination rates. One should be careful not to conclude that just because a correlation exists between variables, it does not prove that a cause and effect relationship exists.