
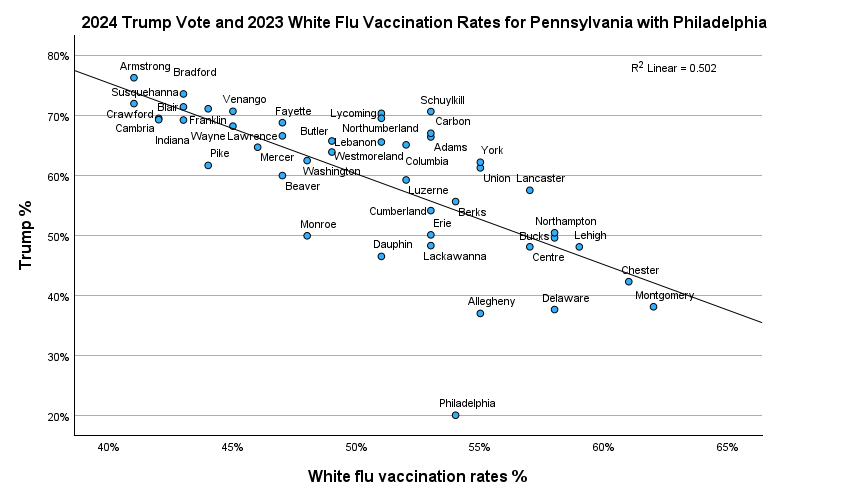
In a follow up to the last post on flu vaccinations and the Trump 2024 vote in Pennsylvania, county level white rates will be looked at. Out of the 67 counties in PA, 44 of them have flu vaccination rates for whites, 43 have rates for African Americans, 38 have rates for Asian Americans, and 35 have rates for Hispanics. The correlations with counties with white flu vaccination and Trump vote were the only ones significantly correlated.

The above graph shows the correlation between white flu vaccination rates on the x axis and the Trump 2024 vote on the y axis. With Philadelphia county included, this relationship accounts for 50.2% of the variability in the 44 counties. This is greater than the 40.8% of the variability in the overall rates for all 67 counties. As usual Philadelphia county is an outlier. Next we will look at the white rates with Philadelphia excluded.

The above graph shows the rates for white flu vaccinations and Trump’s vote with Philadelphia excluded. This time the percentage of variance accounted for increases to 58.7%. For the 66 counties with the overall flu vaccination rate and Philadelphia excluded, 51.1% if the variance is accounted for.
That only 44 of the 67 counties have rates for whites is of concern. Each of the 23 counties with no rate for whites or other ethnic groups were overwhelmingly white. Also each of the 23 counties were won by Trump with 59.99% of the vote or more. The table below shows the numbers for these 23 counties.
Counties with No Flu Vaccination Rates by Ethnicity
| County | Flu Vaccination % | Trump % | Corona Virus Vaccination Rate | ||
|---|---|---|---|---|---|
| 1 | Bedford | 37.00% | 84.01% | 33.92% | |
| 2 | Cameron | 40.00% | 74.54% | 51.20% | |
| 3 | Clarion | 42.00% | 76.20% | 39.87% | |
| 4 | Clearfield | 42.00% | 75.39% | 45.05% | |
| 5 | Clinton | 53.00% | 70.00% | 40.86% | |
| 6 | Elk | 48.00% | 73.12% | 51.72% | |
| 7 | Forest | 40.00% | 71.77% | 67.09% | |
| 8 | Fulton | 33.00% | 86.08% | 27.68% | |
| 9 | Greene | 38.00% | 71.47% | 42.06% | |
| 10 | Huntingdon | 43.00% | 76.12% | 44.57% | |
| 11 | Jefferson | 40.00% | 78.84% | 43.59% | |
| 12 | Juniata | 51.00% | 80.31% | 36.72% | |
| 13 | McKean | 42.00% | 73.17% | 39.64% | |
| 14 | Mifflin | 55.00% | 77.86% | 43.72% | |
| 15 | Montour | 58.00% | 59.99% | 69.75% | |
| 16 | Perry | 46.00% | 74.14% | 43.09% | |
| 17 | Potter | 26.00% | 80.73% | 32.65% | |
| 18 | Snyder | 54.00% | 73.18% | 38.80% | |
| 19 | Somerset | 39.00% | 78.26% | 43.54% | |
| 20 | Sullivan | 43.00% | 73.13% | 49.18% | |
| 21 | Tioga | 38.00% | 75.38% | 39.34% | |
| 22 | Warren | 43.00% | 69.22% | 41.97% | |
| 23 | Wyoming | 49.00% | 67.91% | 54.31% | |
| 24 | Pennsylvania | 52.00% | 50.37% | 51.85% | |
| Total | N | 24 | 24 | 24 | 24 |