
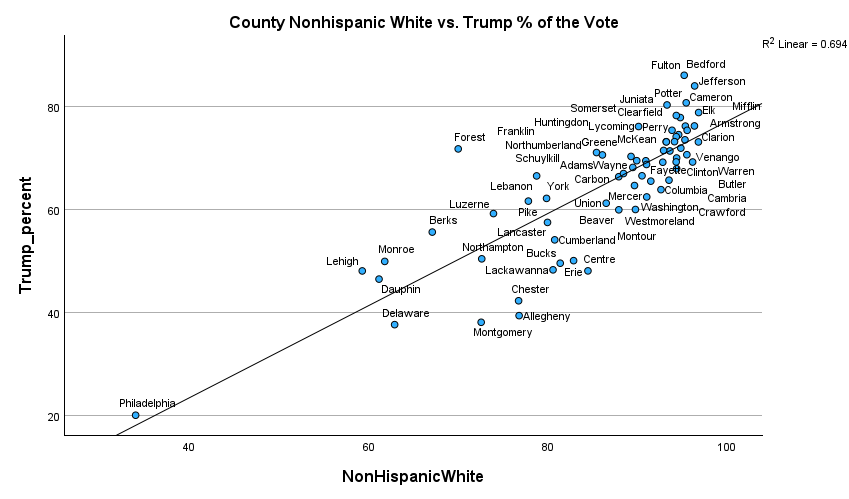
This is the last in the series of County Health Rankings and Trump’s Vote in PA. Accordingly, this post looks at the “Percentage of population identifying as non-Hispanic white. The 2025 Annual Data Release used data from 2023 for this measure.” The question is how does this predict Trump’s vote in Pennsylvania? Altogether the multiple regression model states that for every 1% increase in the non-Hispanic white population, there is a predicted 0.343% increase in Trump’s vote. This relationship had the second highest level association with Trump’s vote behind the % with some college.

As an illustration, the univariate relationship between the non-Hispanic white population and Trump’s vote in Pennsylvania is shown to be strong in the graph above. Sixty-nine point 4 percent of the variability in Trump’s vote is explained by the size of the white population in that county. There are no strong outliers as all PA counties are reasonably close to the regression line.
Some College Review

The association between the % with some college and Trump’s vote accounted for 55.8% of the variability. As can be seen in the graph above, Forest and Philadelphia counties were outliers in this relationship. With these 2 counties excluded, 63.2% of the variance was accounted for.
The model provides a clear picture of the factors that made Trump’s win in Pennsylvania in 2024. Counties with fewer flu vaccinations, less access to exercise opportunities, less severe housing cost burden, and fewer individuals with at least some college were more likely to vote for Trump. Also counties with more census participation and with a larger non-Hispanic white population were more likely to vote for Trump. On the negative side, the flu, exercise, housing cost burden, and college variables are associated with mental and physical well being. Census participation represents more civic engagement. The size of the white population suggests an undercurrent of race.
Allegheny Independent Media is affiliated with Nonprofit Partners. It is a subsidiary of the Community Foundation for the Alleghenies. Through the site you can donate to the website. It is essential to allow us to provide coverage to the critical issues facing the Alleghenies. You may donate to our site here.