
Last week I met with two filmmakers who were doing a documentary film on faith and the economy in the Johnstown area. I was telling them about my blog and my regression model that predicted 78.5% of the variability in Trump’s vote in the 50 states plus the District of Columbia with the predictor variables % uninsured, % of the population with a bachelor’s degree or higher, and % of the states population that is white. They asked me what % of the states’ religiosity predicted in Trump’s vote. It seemed like a worthwhile variable to add to the model.
First I had to see what state level measures of religiosity were available publicly. I saw the Pew Research Center came out with a measure of the % of individuals who were highly religious in their state. The measure is a composite of four variables.
- Importance of religion in people’s lives
- Frequency of prayer
- Worship attendance (eg. church service)
- Belief in God
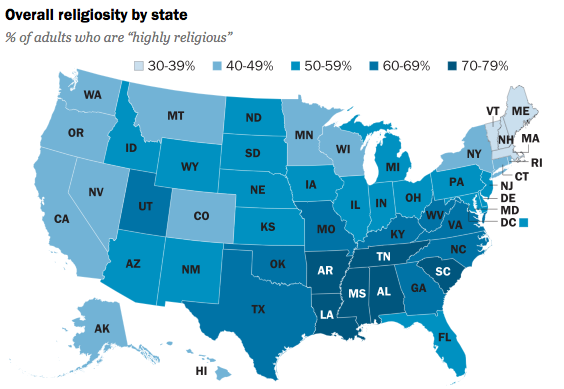
When I added this variable to the model with the other three predictors, to my surprise, it along with the other three predictors were all significant. The model now accounts for 82.4% of the variability in Trump’s vote in at the state level. The table of coefficients is given below.
|
|
Coefficients
|
Standard Error
|
t Stat
|
P-value
|
Lower 95%
|
Upper 95%
|
|
Intercept
|
21.993
|
12.377
|
1.777
|
0.082
|
-2.922
|
46.907
|
|
% uninsured
|
0.559
|
0.244
|
2.290
|
0.027
|
0.068
|
1.050
|
|
% bachelor’s degree or higher
|
-0.838
|
0.161
|
-5.221
|
0.000
|
-1.162
|
-0.515
|
|
% White
|
0.388
|
0.062
|
6.233
|
0.000
|
0.263
|
0.514
|
|
% highly religious
|
0.307
|
0.097
|
3.176
|
0.003
|
0.113
|
0.502
|
Only the intercept is not significant is the intercept which is the predicted value of Trump’s vote if all of the predictor variables have a value of zero. The % bachelor’s is negatively associated with Trump’s vote while the other three are positively associated.

**Related Posts**