
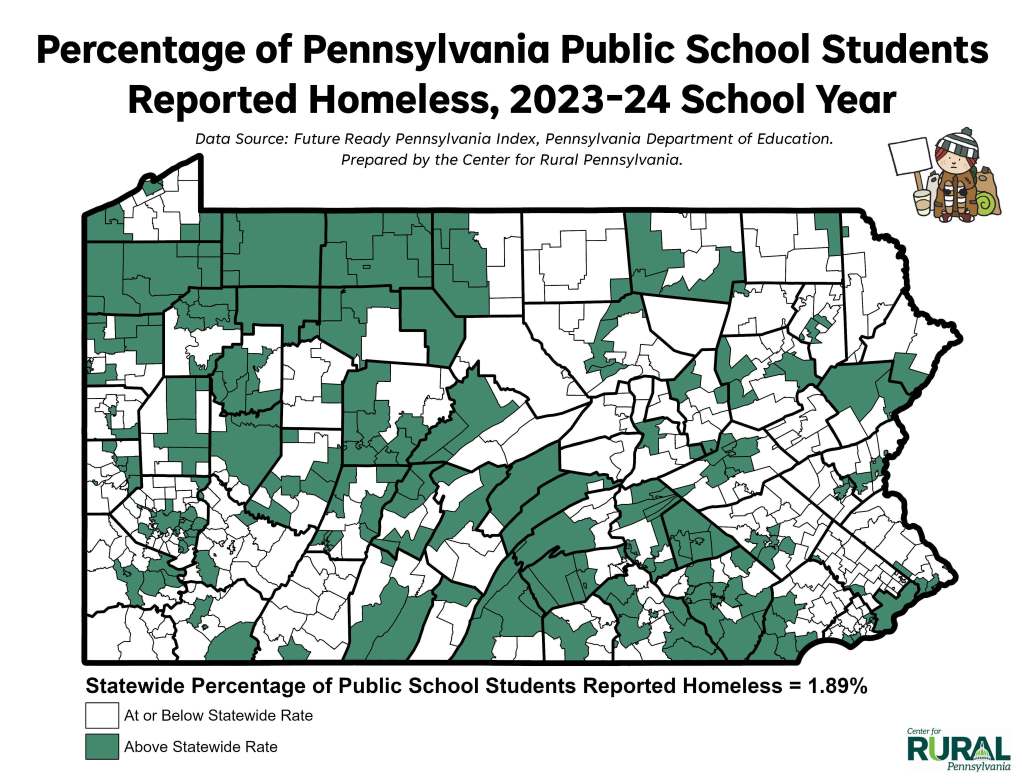

The last post on student homelessness in Cambria County School Districts got a huge response. The map above from the Center for Rural Pennsylvania shows that this issue is not just a Cambria phenomenon. This post will take a look at student homelessness in the Alleghenies outside Cambria County.
Not all of the school districts in the state could be sampled for the 2024-2025 school year. The top 20 poorest school districts according to the Census Bureau from the year 2023 in Pennsylvania were sampled. The Johnstown and Ferndale school districts were excluded because they are located in Cambria County. The school districts of Philadephia, Pittsburgh, Altoona, Indiana, Bedford and State College were included for comparison. In addition to the homeless rates, the rates of economically disadvantaged and special education students were included. The table below presents the rates for poor school districts both inside and outside the Alleghenies.

Seven of the 28 school districts above had homeless rates higher than Greater Johnstown of 5.7%. Forest, Harrisburg, Sto-Rox and York had homeless rates in the double digits. Sto-Rox was by far the highest at 20.4%. Below is a table showing the trends for Sto-Rox from the ’19-’20 to ’24-’25 school years.
Sto-Rox
| Student Group | 2019-2020 | 2020-2021 | 2021-2022 | 2022-2023 | 2023-2024 | 2024-2025 |
|---|---|---|---|---|---|---|
| Economically Disadvantaged | 91.2% | 92.7% | 94.5% | 95.2% | 97.1% | 97.6% |
| English Learner | 1% | 0.9% | 0.7% | 1.5% | 1.2% | 2.4% |
| Special Education | 21.7% | 26.4% | 26.2% | 27.5% | 26.9% | 26.3% |
| Foster Care | 2.7% | 3.3% | 4.3% | 2.8% | Not Available | Not Available |
| Homeless | 4.7% | 4.2% | 5% | 4.4% | 8.1% | 20.4% |
| Military Connected | 0% | 0% | 0% | 0% | 0% | 0% |
The table above shows that the rate for Sto-Rox (in Allegheny County) rose from 4.4% in ’22-’23 to 8.1% in ’23-’24 to 20.4% in ’24-’25. This is a 363% increase. This rise occurred after the pandemic ended in May 2023. The rate of economically disadvantaged increased by 7% from ’19-’20 to ’24-’25. Likewise the rate of students in special education increased by 21.2%.
You can look up your own school district in Pennsylvania at Future Ready PA. They also have other demographic and school performance data.