
My last statistical post summarized all of the additional statistics from county health rankings that were related to COVID vaccination rates in the 10 county area. For this post, I will look at COVID Case Mortality rates and just a few related statistics. This is for simplicity sake. There are 18 significant variables correlated with COVID case mortality. This will focus on physical and mental distress predicting COVID case mortality.

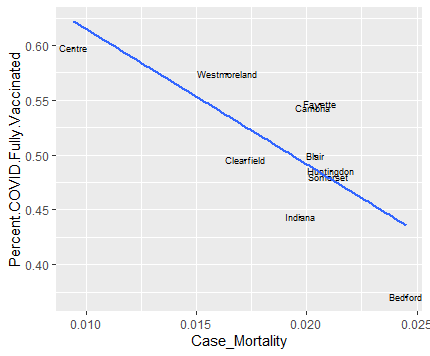
The above graph shows the association between COVID vaccination rates and case mortality. This is a fairly strong association accounting for 55.1% of the variability in both variables. This suggests that COVID vaccines work at curbing mortality.
Physical Distress

The above graph shows the association between the percent of individuals who report frequent physical distress and COVID case mortality. This relationship shows that the two counties with a low of 12% physical distress (Centre and Westmoreland) have low case mortality while the high county at 15% (Fayette) has a higher case mortality. The remaining counties are clustered at 14% physical distress and vary with respect to case mortality. This relationship accounted for 58.6% of the variability. Bedford County is considered an outlier.

We see a similar pattern is seen with the average number of physically unhealthy days in the last month. There is less clustering on this measure and the highest and lowest counties are the same as with the previous graph. This variable accounts for 44.1% of the variability. This percentage is not as high as with the % frequent physical distress but is still significant.
Mental Distress

The relationship between COVID case mortality and the percentage reporting frequent mental distress is summarized in the above graph. Four counties are outside the cluster of six counties at 17%. Fayette County is once again the highest in mental distress at 18%. Huntingdon County is just below the cluster at 16% followed by Centre and Westmoreland at 15%. This relationship accounts for 47.7% of the variability.

This graph shows the relationship between average number of mentally unhealthy days in the last month and case mortality. It also shows a similar pattern to the % mental distress with less clustering. This was the strongest of all the relationships accounting for 65% of the variability.
Clearly, other health measures are associated with COVID mortality and vaccination rates. The results are useful for crafting strategies for combating COVID mortality.